Inverted Platonic idealism
Visible light is a continuous spectral phenomenon. Wavelength distribution is the essential nature of colors. But we live in the tristimulus world. Our eyes cannot see wavelength distribution clearly. We can feel the color rendering property of an illuminant to some extent, but not always, not clearly. The situation reminds me of Platonic idealism.
Plato thought that only ideas are the essential nature of things; Tangible things are non-essential; Only ideas are truth, universal, and eternal; Our five senses are an unreliable way to know ideas; The right way to true ideas is introspection and logic.
His idealism looks similar to the relationship between colors and wavelength distribution. Our vision is an unreliable way to know wavelength distribution. The right way to true wavelength distribution is a spectrophotometer and tunable light source (wavelength variable monochromatic light source), about 40,000 USD instruments in total. Platonism is affordable.
Advanced academic color science should work on this 40,000 USD problem. Today I bring you such an article: Camera Spectral Sensitivity Estimation from a Single Image under Unknown Illumination by using Fluorescence.
Spectral sensitivity of a color image sensor
A color image sensor has three (RGB) or four (RGBG, Bayer arrangement) color filters for each pixel. The filters should mimic the spectral sensitivity of human cone cells, but it cannot be perfect. How much? We can feel it to some extent, but not always, not clearly. To investigate it, we usually need a tunable light source (20,000 USD).
A clever color scientist found a cheap substitute for a tunable light source: A fluorescence color chart. A fluorescent agent radiates light with its own characteristic wavelength distribution. Different agents have different distributions. Collecting them a lot (16 agents in the article) and making a fluorescence color chart, and with mathematical magic, we can know the spectral sensitivity of a color image sensor in a camera.
And cleverer, it doesn’t require any specific illuminant. The color chart, the calculation app, a camera to investigate, and the sunlight, that’s all.
“Oh nice I want the color chart and the calculation app.” Me too. But they are not on sale yet AFAIK. This is an academic study. I hope someone makes it a business someday.
How about the precision?
A bit disappointing, so far.
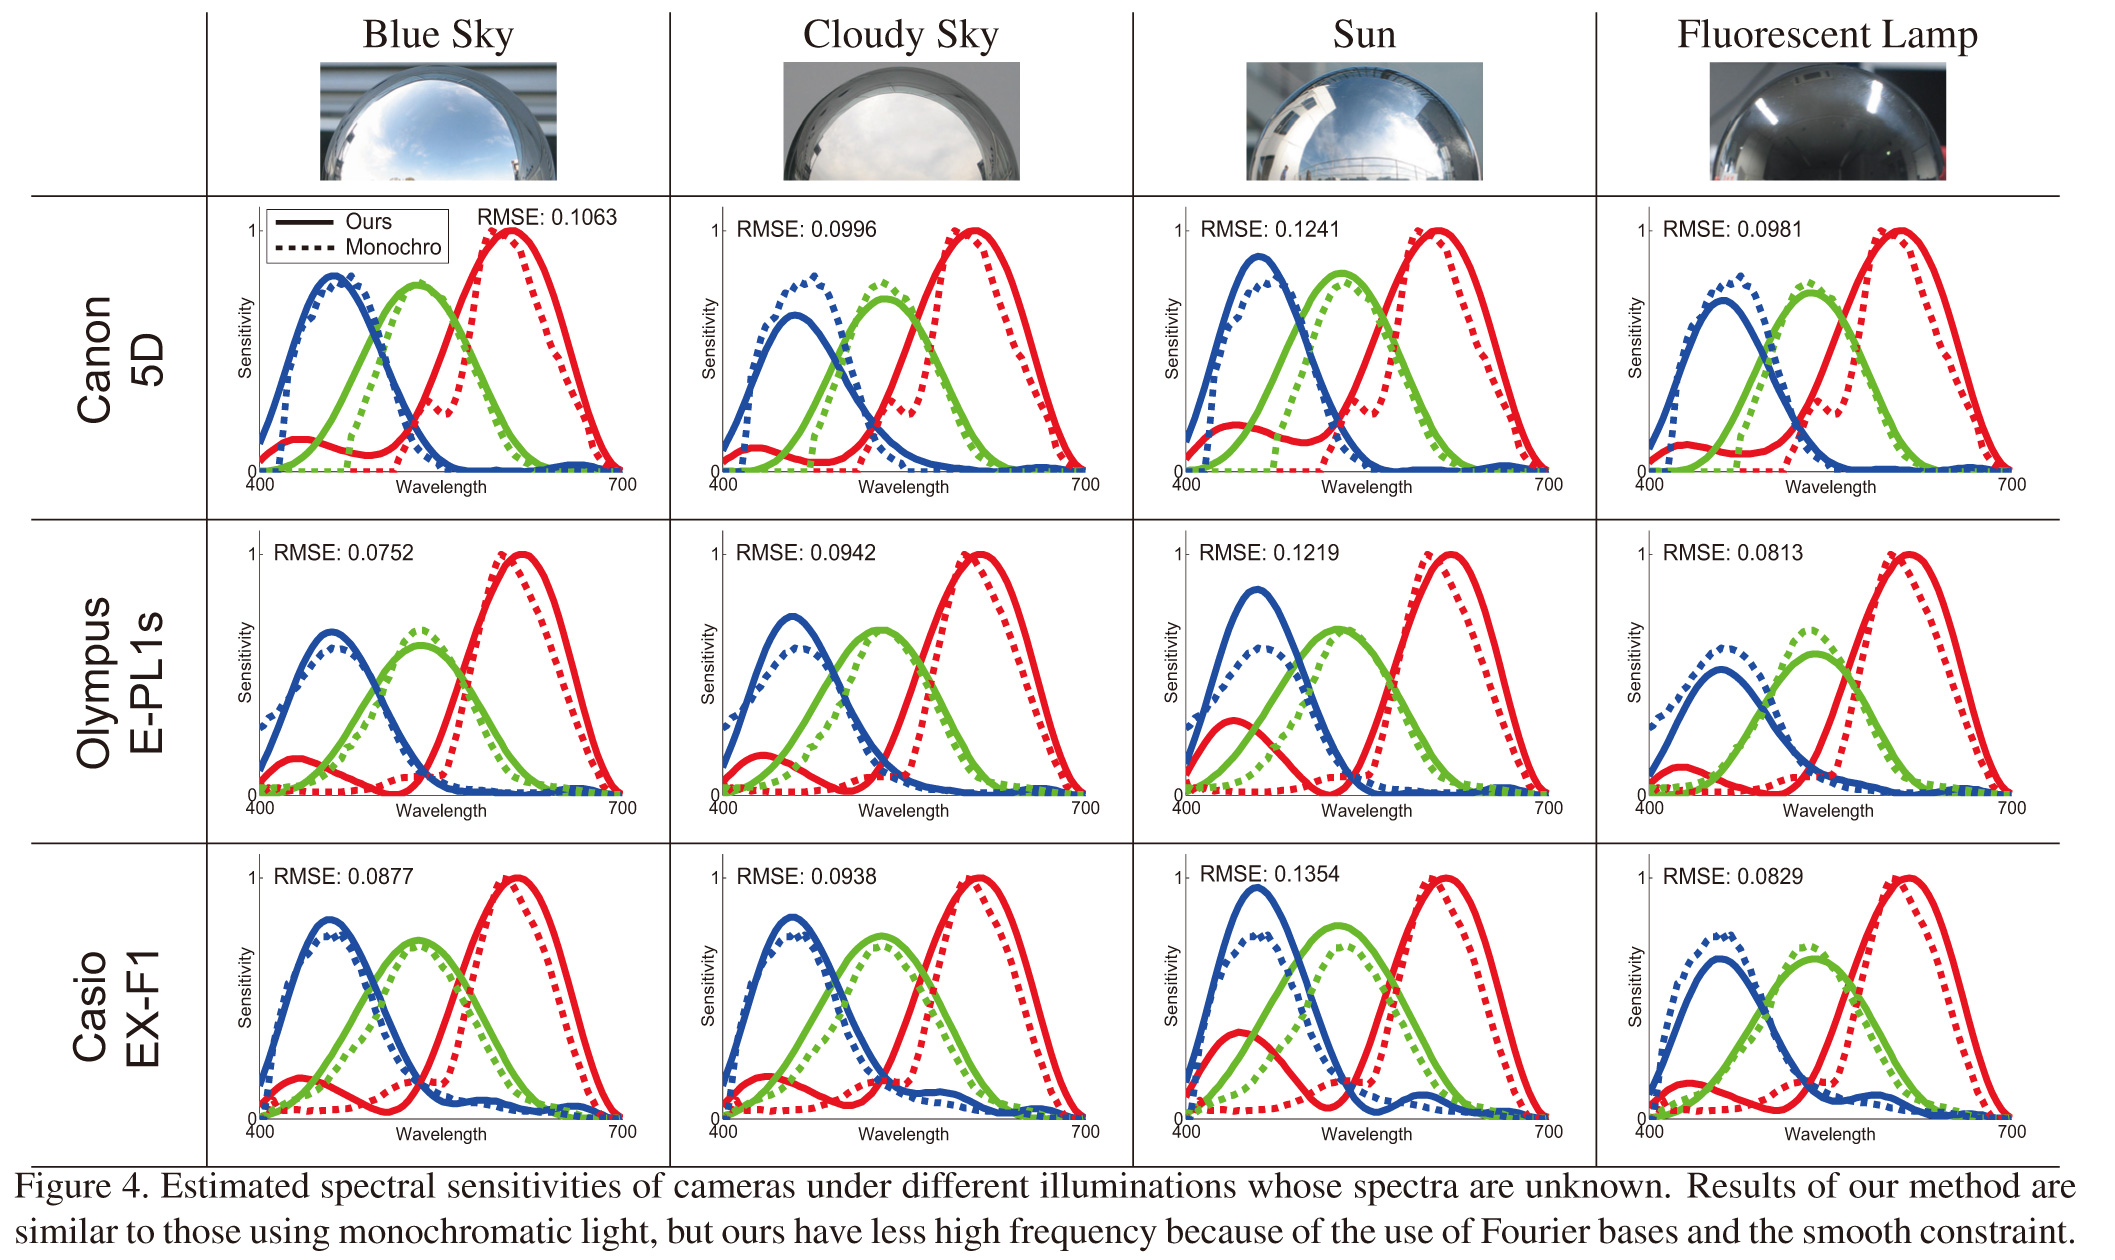
But this is an academic study, not even pre-alpha version. I see no showstopper to the principle.